Have you ever found yourself on the reservation at Indian Creek wondering, "hmm, I wonder how my tribe's water quality has fared over the last 15 years?"
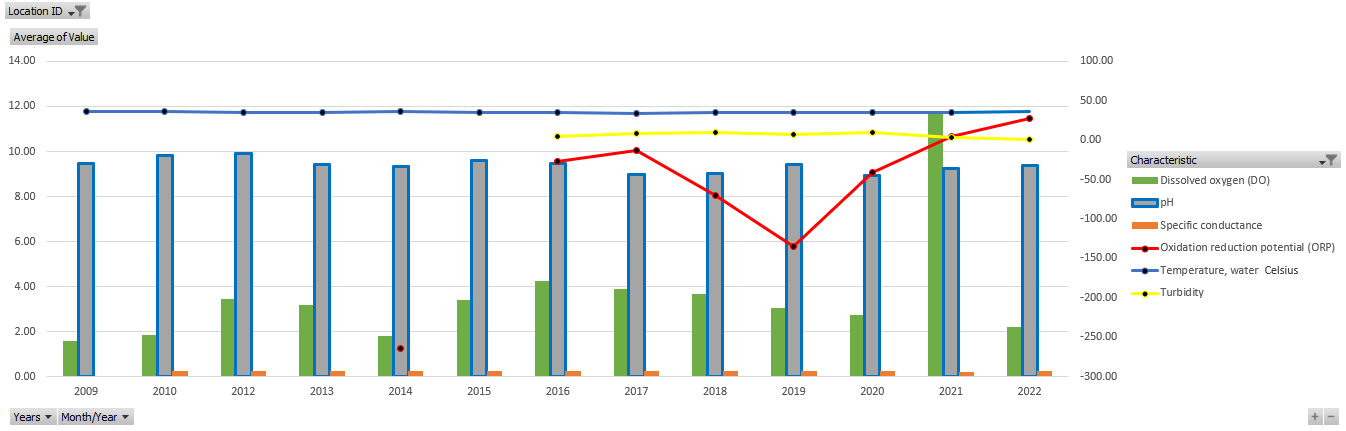
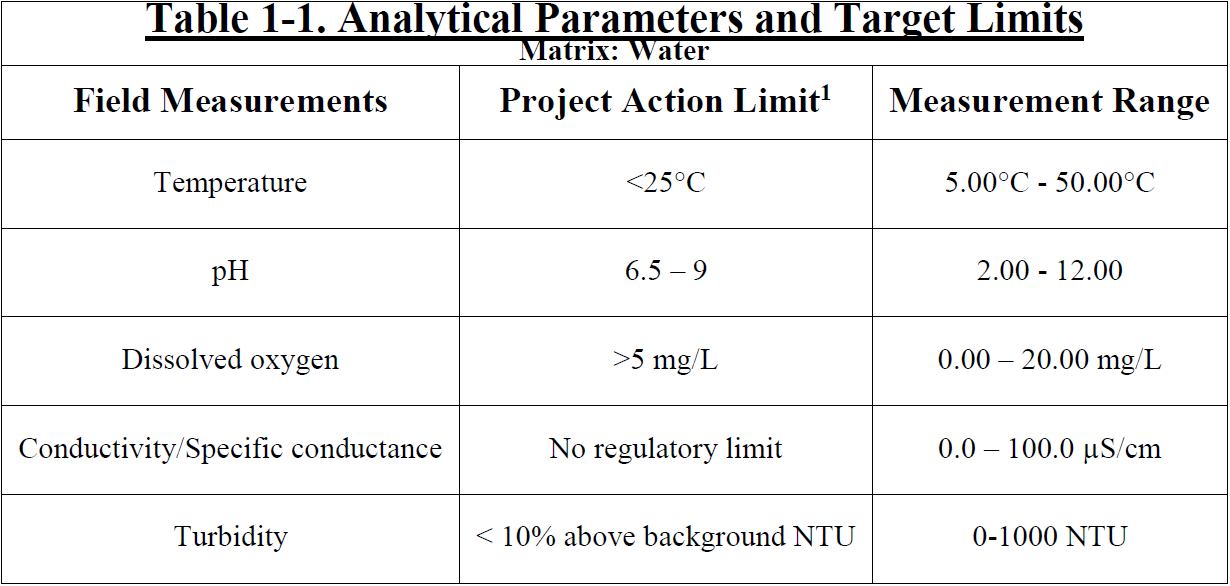
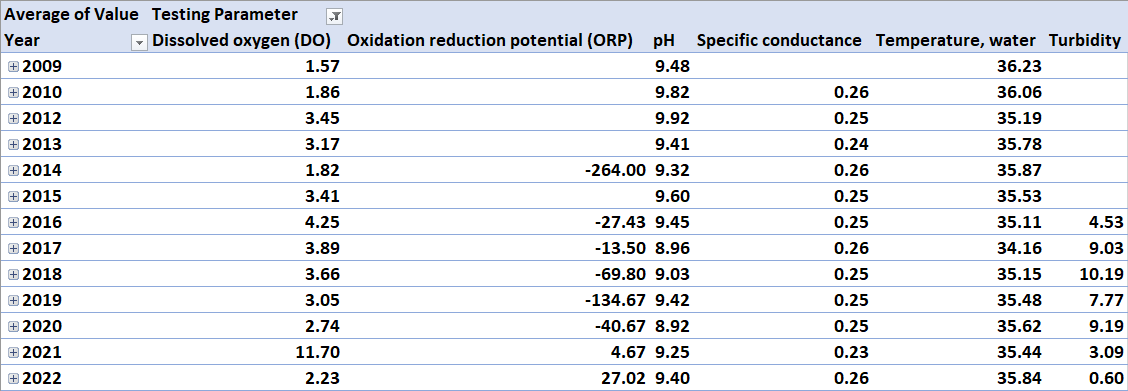
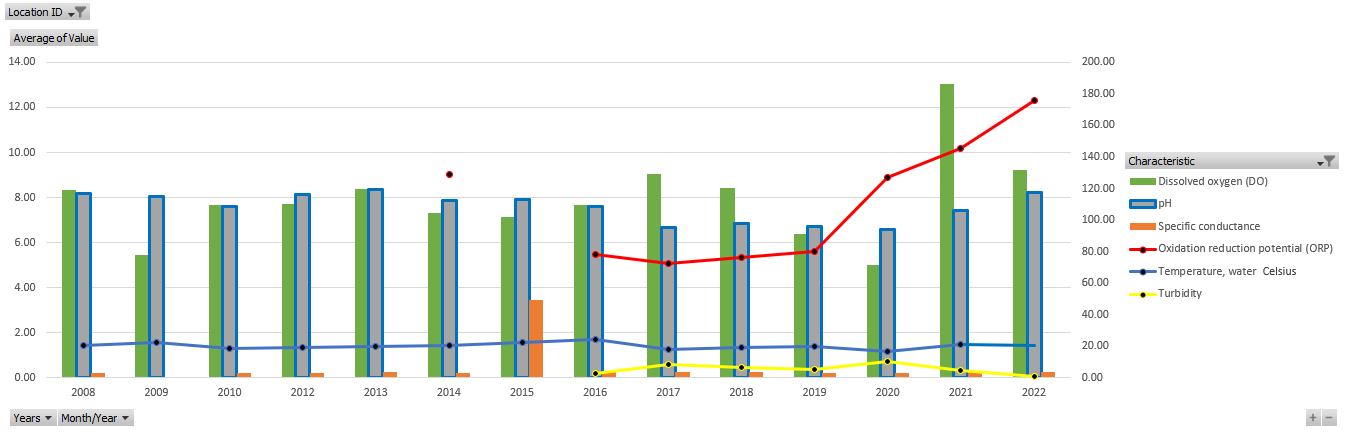
Wonder no more, our Soboba Tribal Environmental Department (STED) has done the work for you in compiling all the data from the beginning of our CWA 106 grant cycle starting in 2008. Below you will be able to view all the data averages from both Indian Creek (1st) and Ramona Hot Springs (2nd) in two dual-axis charts. the chart's X-axis shows the year, Left Y-axis shows the value of the bars, the Right Y-axis shows the values of the lines, and the legend shows the parameters being tested. If graphs aren't your thing, subsequent tables (3rd & 4th) can be found below as well as the target limits for existing parameters (5th). If you're curious, feel free to reach out to STED with any questions you might have in regards to testing and data or leave a comment on our contact-us page!
IC2
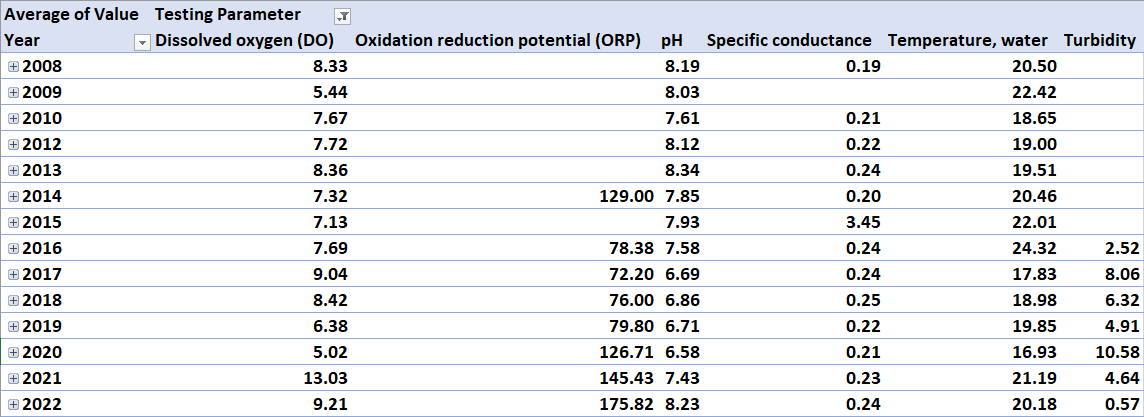
ICHS
IC2
ICHS